|
About Us
My Equipment
|
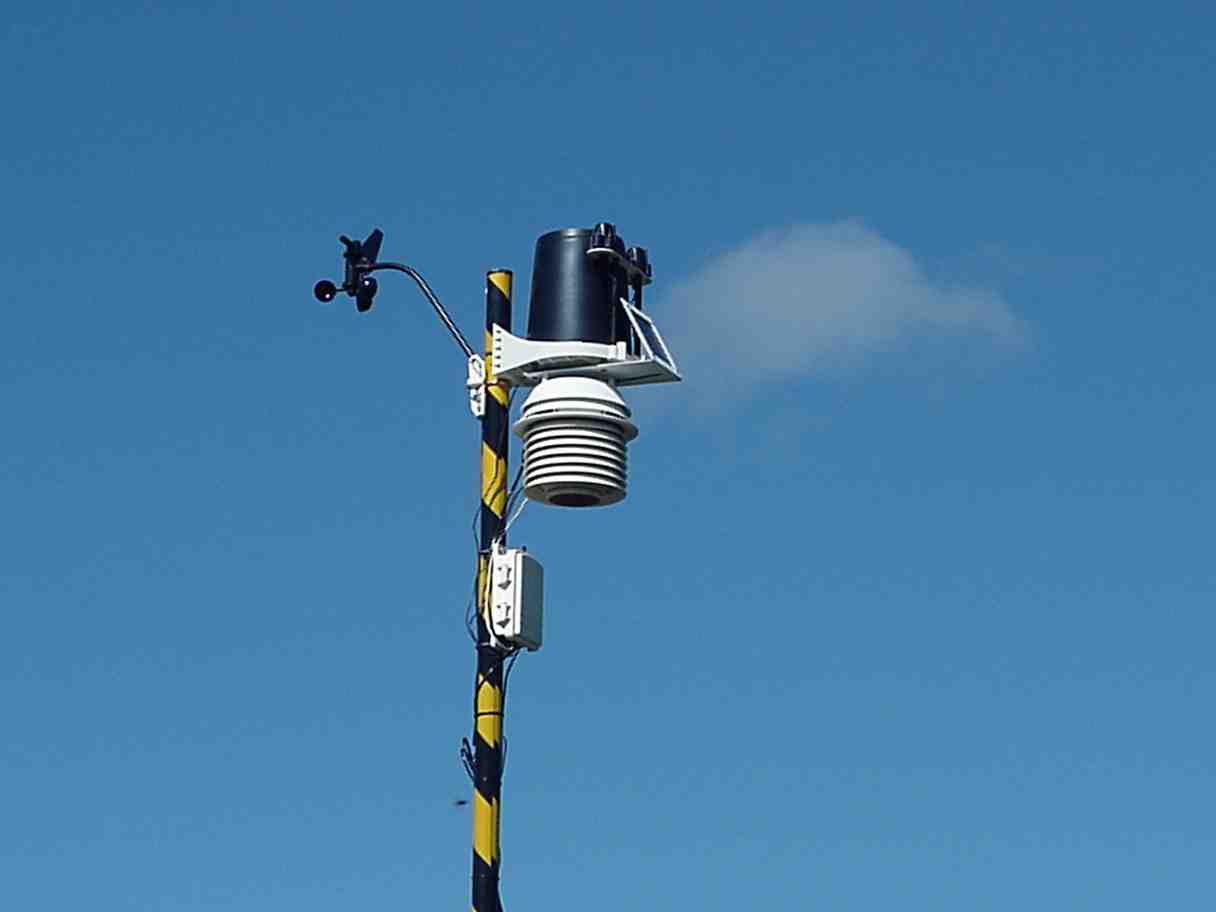
Davis Vantage Pro Plus |
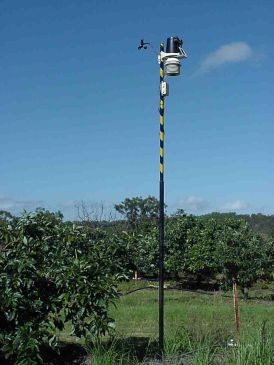
Davis VPP in field |
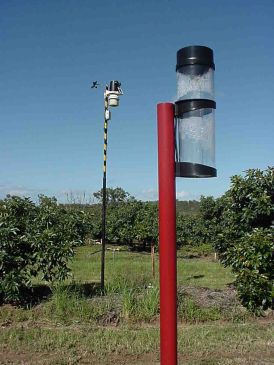
Rain Guage |
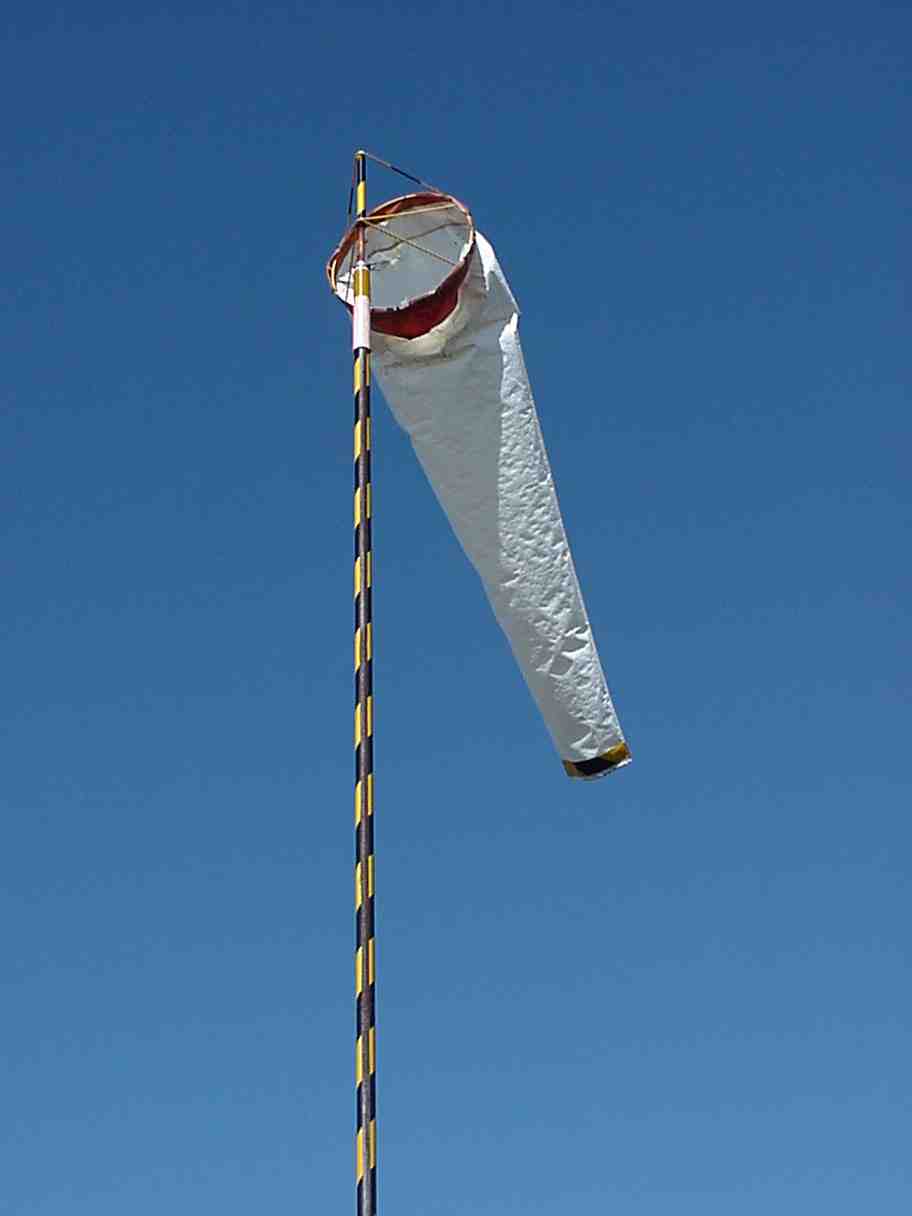
Wind Sock |
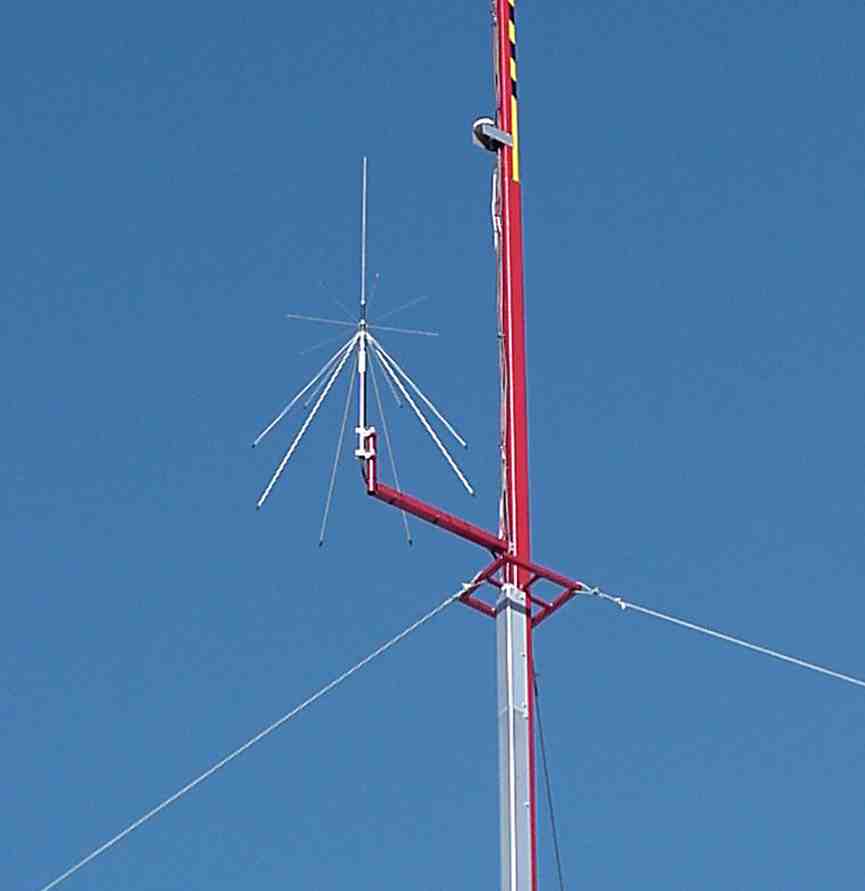
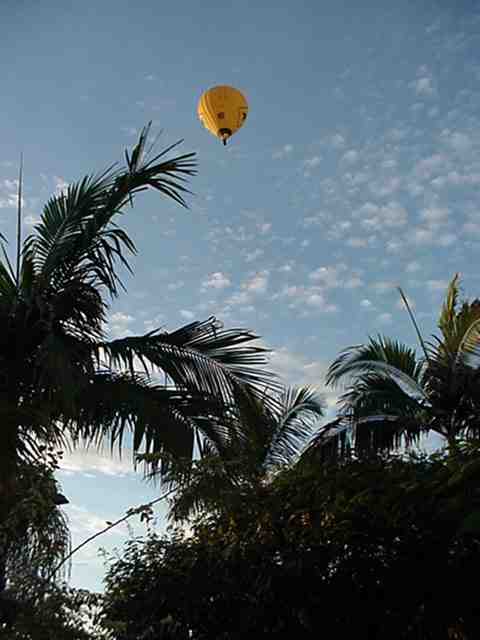
Discone Antenna |

North-West |

North |

North-East |

West |
|

East |

South-West |

South |

South-East |
TEMPERATURE
Vantage Pro Plus uses the Integrated Sensor Suite's (ISS)
temperature sensor to measure the outside air temperature. A second temperature
sensor in the console measures the inside air temperature.
APPARENT TEMPERATURE MEASURES
The Vantage Pro Plus Weather Station at Gorge Creek Orchards
calculates apparent temperature readings; wind chill and heat index:
WIND CHILL
Wind Chill takes into account how the speed of the wind
affects our perception of the air temperature. Our bodies warm the surrounding
air molecules by transferring heat form the skin. If there's no air movement,
this insulating layer of warm air molecules stays next to the body and offers
some protection from cooler air molecules. However, wind sweeps that comfy warm
air surrounding the body away. The faster the wind blows, the faster the heat
is carried away and the colder you feel. At above 30°C wind movement has no
effect on apparent temperature, so wind chill is the same as the outside
temperature.
HEAT INDEX
The Heat Index uses the temperature and the relative humidity
to determine how hot the air actually "feels". When humidity is low, the
apparent temperature will be lower than the air temperature, since perspiration
evaporates rapidly to cool the body. However, when the humidity is high (ie.
the air is saturated with water vapour) the apparent temperature "feels" higher
than the actual air temperature, because perspiration evaporates more slowly.
HUMIDITY
Humidity itself simply refers to the amount of water vapour
in the air. However, the amount of water vapour that the air can contain varies
with the air temperature and pressure. Relative humidity takes into account
these factors and offers a humidity reading which reflects the amount of water
vapour in the air as a percentage of the amount the air is capable of holding.
Relative Humidity, therefore, is not actually a measure of the amount of water
vapour in the air, but a ratio of the air's water vapour content to it's
capacity. Vantage Pro Plus calculates and displays this relative humidity.
It is important to realise that relative humidity changes
with temperature, pressure and water vapour content. For example, a parcel of
air with a capacity for 10g of water vapour which contains 4g of water vapour,
the relative humidity would be 40%. Adding 2g more water vapour (for a total of
6g) would change the humidity to 60%. If that same parcel of air is warmed so
that it has a capacity for 20g of water vapour, the relative humidity drops to
30% even though the water vapour content does not change.
DEW POINT
Dew Point is the temperature to which air must be cooled for
saturation (100% relative humidity) to occur, providing there is no change in
water content. The Dew Point is an important measurement used to predict the
formation of dew, frost and fog. If Dew Point and temperature are close
together in the late afternoon when the air begins to turn colder, fog is likely
during the night. Dew Point is also a good indicator of the air's actual water
vapour content, unlike relative humidity, which takes the air's temperature into
account. High Dew Point indicates high vapour content; low Dew Point indicates
low vapour content. In addition, a high Dew Point indicates a better chance of
rain and severe thunderstorms.
You can even use Dew Point to predict minimum overnight
temperature. Provided no new fronts are expected overnight and the afternoon
relative humidity >50%, the afternoon's Dew Point gives you an idea of what
minimum temperature to expect overnight, since the air is not likely to get
colder than the Dew Point anytime during the night.
RAINFALL
Vantage Pro Plus provides four separate registers for
tracking rainfall totals: "rain storm", "daily rain", "monthly rain" and "yearly
rain". The Vantage Pro Plus also calculates the rate of rainfall by measuring
the interval of time between each 0.254mm rainfall increment.
BAROMETRIC PRESSURE
The weight of air that makes up our atmosphere exerts a
pressure on the surface of the earth. This pressure is known as atmospheric
pressure. Generally, the more air above an area, the higher the atmospheric
pressure. This in turn means that atmospheric pressure changes with
altitude. For example, atmospheric pressure is greater at sea level than it is
on a mountain top. To compensate for this difference and facilitate comparison
between locations with different altitudes, atmospheric pressure is generally
adjusted to the equivalent sea level pressure. This adjusted pressure is known
as Barometric Pressure.
In reality, the Vantage Pro Plus Weather Station measures
atmospheric pressure, but this is converted to barometric pressure because the
altitude of the Gorge Creek Orchards Weather Centre (540m) has been entered into
the station. This essentially means that the Vantage Pro Plus has stored the
necessary 'offset' value to consistently translate atmospheric pressure into
barometric pressure.
Barometric Pressure also changes with local weather
conditions, making barometric pressure an extremely important and useful weather
forecasting tool. High-pressure zones are generally associated with fair
weather while low-pressure zones are generally associated with poor weather.
For forecasting purposes, however, the absolute barometric
pressure value is generally less important than the change in barometric
pressure. In general, rising pressure indicates improving weather conditions
while falling pressure indicates deteriorating weather conditions.
A Stevenson Screen is a white boxed shelter that contains temperature and
relative humidity equipment. It shields the instruments from sunshine and
precipitations and has louvered sides to permit the free movement of air. The
shelter is placed over grass, mounted 1 meter above the ground and as far from
buildings as circumstances permit.
Climate refers to the average weather conditions at a specific place over a
lengthy period of time (more than 30 years). The climate of a region plays a
role in determining what agricultural crops can be grown in that region. The
World Meteorological Organization, an agency of the United Nations, is
responsible for the international exchange of weather data. It certifies that
the data observation procedures do not vary among the over 130-nation
participants.
Temperature refers to how hot or cold the atmosphere is as measured by a
thermometer (in Celsius (C) or Fahrenheit (F), or Kelvin (K) ). A traditional
thermometer consists of mercury, red spirit or green spirit in a glass tube and
operates on the principle that the liquid expands more that the glass does when
heated. Digital electronic devices can also be used were the unit can record the
max and min temperature reached and some units can store a series of data (a
data logger) and others transmit an electronic signal measuring temperature back
to a second temperature display on a PC or a base. These new probes can also be
used to measure soil temperature.
Atmospheric Pressure - the weight of the atmosphere overhead (the force
exerted on a unit area, such as a square centimeter, by the mass of the
atmosphere as gravity pulls it to earth) - expressed in millibars of inches of
mercury. Commonly measured with a mercury barometer, a glass tube in which the
height of a column of mercury fluctuates as the weight of the atmosphere
changes. Changes in atmospheric pressure signal shifts in the weather and can be
measured with a simple dial barometer.
Humidity refers to the amount of water vapour the air contains. (Expressed as
relative humidity, or the amount of water vapour air contains expressed as a
percentage of the maximum amount it can hold at the same temperature). Cool air
holds less water than warm air.
Measuring Humidity; A Psychrometer is an instrument used to measure relative
humidity. It traditionally consists of two thermometers, one covered with a wet
cloth. Evaporation cools this thermometer below the actual air temperature,
recorded on the dry thermometer. Evaporation and cooling depends on how dry the
air is at a given temperature. A table can be used to determine the relative
humidity from the amount of cooling. Digital electronic instruments
(hygrometers) can be used for quick readings and more upmarket units offer data
logging. Some instruments offer a simple dial readying of Relative Humidity,
while these offer the least accuracy they can be used as a good indication.
Growing Degree Day (or Heat Units) - a measure of the departure of the mean
daily temperature above or below a given standard. Information can be used to
optimize timing of planting, fertilizing, pesticide application and harvesting.
Growing Season - the period of the year when crops and other plants grow
successfully. Calculated by the average number of days between the last heavy
frost in spring and the first severe frost in autumn. The length of the growing
season varies from place to place and partially determines what crops can be
grown in an area.
Precipitation is a term that covers all of the forms in which water falls to
earth from the atmosphere. Main types: rain, snow, sleet and hail. Precipitation
is life-sustaining - its amount and distribution a regions receives plays a
major role in determining what can survive there and what plants can be grown.
A tipping bucket is an instrument used to measure precipitation. It contains
a dual-chamber mini-collection bucket located beneath a collection funnel. When
precipitation fills one side of the bucket, gravity empties it and sends a
signal to the data logger. Some tipping buckets are equipped with internal
heaters to melt snow and frozen rain.
Simple rain gauges. Basically, any measuring glass left outside can serve as
a rain gauge. However, since most rain showers are usually quite windy, you'll
want to fasten your rain gauge somewhere so that it doesn't blow over. Locate a
good place for your gauge. There should be nothing overhead, like trees,
electric wires, or the edge of a roof. These obstructions can direct rainwater
into or away from your gauge, creating a false reading. The edge of a fence,
away from the building, is often a good place for your gauge. Tip: A ring of
slated metal around the perimeter of the rain gauge provides a wind shield to
decrease splash and wind-induced errors. Once you have found the spot, attach a
holding rack. Then, slip your measuring glass into position. Wait for rain, then
record your measurement, and empty the glass.
Rain refers to liquid precipitation that falls from clouds as drop 0.5 millimeters in diameter or larger. Drizzle consists of drops smaller than 0.5mm.
Hail originates when colliding drops of water freeze together in the cold
upper regions of a thunderstorm. Hail can cause considerable damage to
agricultural regions, depending on the size and intensity of the hail storm. At
12:15, May 30, 1985 45 cm of hail fell in the Leamington area causing damage to
plants and greenhouses.
Drought refers to a prolonged period of greatly reduced precipitation.
Droughts can last a few weeks (in which case they are called dry spells) or
months, or even years.
Frost refers to the white coating of ice crystals you often see on or near
the ground after a cold night. Frost occurs through a process called sublimation
where a gas, such as water vapour, becomes a solid, or when a solid becomes a
gas without first becoming a liquid. (i.e. a leaf losses heat during the night.
If the leaf's temperature falls below 0 C, water vapour in the surrounding air
will freeze on it. Fruit growers are concerned about "killing frosts".
(Temperatures that are far enough below freezing to harm cold-sensitive plants
such as peach trees
Wind is the movement of air. It arises because of differences in temperature
and atmospheric pressure between nearby regions of the earth. Winds tend to blow
from areas of high pressure to areas of low pressure. It is one of the weather's
most changeable forces. It can change form a light breeze to a fierce storm
within a short time. Wind has been carefully measured for centuries
What is a MED?
Minimum Erythemal Dose (MED) is the amount of sunlight exposure necessary to
induce a barely perceptible redness of the skin within 24 hours after sun
exposure. In other words, exposure to 1 MED results in a reddening of the skin.
You can determine the number of minutes of sun exposure it takes to burn by
dividing 60 by the MEDs per hour. We use the term "skin factor" to describe how
different skin types burn at different rates.
What is "skin factor"?
MED stands for Minimum Erythemal Dose, which is defined as the amount
sunlight exposure necessary to induce a barely perceptible redness of the skin
within 24 hours after sun exposure. As different skin types burn at different
rates, MED's may be scaled to take into account skin type. The lower the skin
factor, the longer it takes the skin to burn.
How do you know what your skin factor is?
You can find your skin type from the following table:
I - Always burns easily, never tans - 1.2 to 1.4
II - Always burns easily, tans minimally - 0.9 to 1.1
III - Burns moderately, tans gradually & uniformly - 0.7 or 0.8
IV - Burns minimally, always tans well - 0.5 or 0.6
V - Rarely burns, tans profusely - 0.4 or 0.5
VI - Never burns, deeply pigmented - 0.3 or 0.4
Warning: Be aware that skin types relate only to the sun burning effects of
UV. Other UV-related health problems such as cataracts and immune system
suppression do not relate to skin type.
What is UV radiation and what does the UV index mean?
Energy from the sun reaches the Earth as visible, infrared, and ultraviolet
(UV) rays. Exposure to UV rays can cause numerous health problems, such as
sunburn, skin cancer and other skin damage, cataracts, and can suppress the
immune system. The Health EnviroMonitor can help analyze the changing levels of
UV radiation and can serve to warn of situations where exposure is particularly
unacceptable. The UV Index assigns a number between 1 and 16 for the current UV
intensity. The lower number the lower the danger of sunburn. Here are exposure
categories according to index values:
Index Values
Exposure Category
0 - 2 -- Minimal
3 - 4 -- Low
5 - 6 -- Moderate
7 - 9 -- High
10 + -- Very High
What is a cooling/heating degree day?
Cooling degree-days is a unit of measure for calculating the effect of
temperature on the consumption of energy (e.g. electricity) to cool a location.
Temperature plays an important part in the consumption of energy to cool a house
or other structure. Heating Degree-days is a unit of measure for calculating the
effect of temperature on the consumption of energy (e.g. heating oil) to heat a
location, essentially the opposite of Cooling Degree-days.
What is temperature/humidity index?
Temperature-Humidity Index (THI) commonly called heat stress, uses
temperature and relative humidity to determine how hot the air temperature
actually "feels". When humidity is high the apparent temperature is higher than
the air temperature.
What is meant by wind run?
Wind run is a measure of the amount of wind which passes a given point during
the measurement period.
What is ET and what readings are used to calculate ET?
Evapotranspiration ( ETo ) is a measure of the amount of water vapor that
returns to the air in a given area. It combines the amount of water vapor
returned through evaporation (water leaving the earth) with the amount of water
vapor returned through transpiration (water leaving plants) to arrive at a total
for the area.
What is a growing degree day and how is it calculated?
Growing degree-days is a measure for calculating the effect of temperature on
the development of plants and pests. The GroWeather uses the temperature reading
in conjunction with the base and upper thresholds that you set to calculate
degree-days.
How does barometric pressure differ from atmospheric pressure?
Atmospheric pressure is the total pressure exerted on an object taking into
account the effects of altitude. Barometric pressure is a pressure that does not
take into account the effects of altitude, only those of the current weather
system. It's as if it were atmospheric pressure at sea level.
Heat Index Table (degrees C)
|
Environmental temperature (C) v Relative Humidity (%) |
|
|
26 |
28 |
30 |
32 |
34 |
36 |
38 |
40 |
42 |
44 |
|
0% |
25 |
27 |
28 |
30 |
32 |
33 |
35 |
36 |
37 |
38 |
|
10% |
25 |
27 |
28 |
30 |
32 |
33 |
35 |
37 |
39 |
41 |
|
20% |
24 |
27 |
28 |
30 |
32 |
34 |
37 |
39 |
42 |
46 |
|
30% |
26 |
27 |
29 |
31 |
33 |
36 |
39 |
43 |
47 |
52 |
|
40% |
26 |
28 |
30 |
32 |
35 |
39 |
43 |
48 |
54 |
60 |
|
50% |
27 |
28 |
31 |
34 |
38 |
43 |
49 |
55 |
62 |
|
|
60% |
27 |
29 |
33 |
37 |
42 |
48 |
55 |
62 |
|
|
|
70% |
27 |
31 |
35 |
40 |
47 |
54 |
63 |
|
|
|
|
80% |
28 |
32 |
38 |
44 |
52 |
61 |
|
|
|
|
|
90% |
28 |
34 |
41 |
49 |
58 |
|
|
|
|
|
|
100% |
28 |
36 |
44 |
56 |
|
|
|
|
|
|
Beaufort Scale - Wind Speed & Observed Effects
| Force |
Knots |
Mph |
Kph |
Sea Term |
Sea Conditions |
On-land Appearance |
| 0 |
<1 |
<1 |
<1 |
Calm |
sea like a mirror |
smoke rises vertically |
| 1 |
1-3 |
1-3 |
1-6 |
Light air |
ripples with appearance of scales: no foam crests |
smoke drifts and leaves rustle |
| 2 |
4-6 |
4-7 |
7-11 |
Light breeze |
small wavelets: crests of glassy appearance, not breaking |
wind felt on face |
| 3 |
7-10 |
8-12 |
12-19 |
Gentle breeze |
large wavelets: crests begin to break: scattered whitecaps |
flags extended, leaves move |
| 4 |
11-16 |
13-18 |
20-30 |
Moderate breeze |
small waves, becoming longer: numerous whitecaps |
dust and small branches move |
| 5 |
17-21 |
19-24 |
31-39 |
Fresh breeze |
moderate waves, taking longer form: many whitecaps: some spray |
small trees begin to sway |
| 6 |
22-27 |
25-31 |
40-50 |
Strong breeze |
larger waves forming: whitecaps everywhere: some spray |
large branches move, wires whistle |
| 7 |
28-33 |
32-38 |
51-61 |
Near gale |
sea heaps: white foam from breaking waves begins to be blown in streaks |
trees in motion, resistance felt when walking |
| 8 |
34-40 |
39-46 |
62-74 |
Gale |
moderately high waves of greater length: edges of crests begin to break into spindrift: foam is blown in well-marked streaks |
walking impeded |
| 9 |
41-47 |
47-54 |
75-87 |
Strong gale |
high waves: sea begins to roll: dense streaks of foam: spray may reduce visibility |
structural damage may occur |
| 10 |
48-55 |
55-63 |
88-102 |
Storm |
very high waves with overhanging crests: sea takes white appearance as foam is blown in very dense streaks: rolling is heavy and visibility is reduced |
trees uprooted, structural damage likely |
| 11 |
56-63 |
64-72 |
103-117 |
Violent Storm |
Exceptionally high waves: sea covered with white foam patches: visibility still more reduced |
damage to structures wide spread |
| 12 |
>63 |
>72 |
>117 |
Hurricane |
air filled with foam: sea completely white with driving spray: visibility greatly reduced |
severe structural damage to buildings, wide spread devastation, flooding |
|